Welcome to DataInsights
Create Your First Project
Start adding your projects to your portfolio. Click on "Manage Projects" to get started


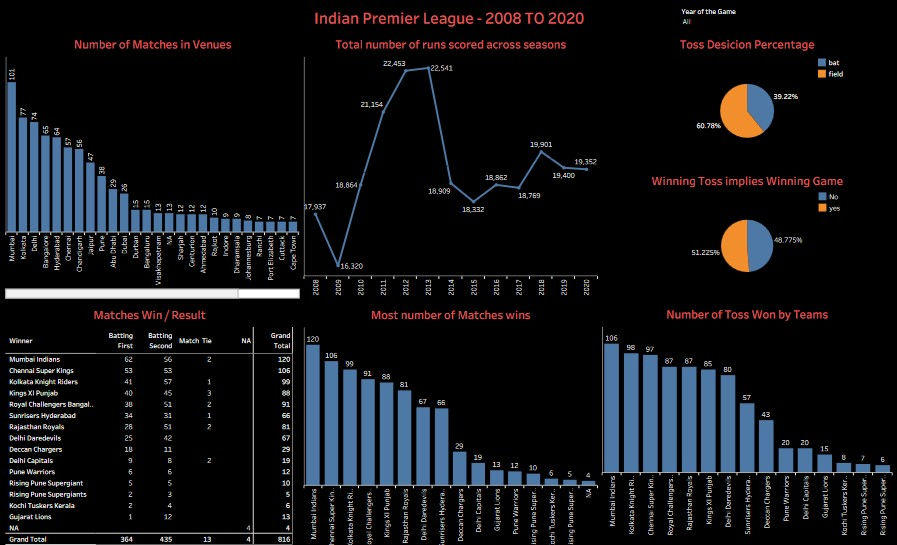
Indian Premier League - 2008 TO 2020 - Analysis done using Excel, R- Programming and Tableau
Project type
Excel, R- Programming and Tabluea
Analysis Done by
Oct'23
Tableau : Dashboard Link
Analysis Report Link
Analysis - Indian Premier League Matches: Done in Tableau.
How many runs were scored in each season?
What were the runs scored per match in different seasons?
Which team has won the most tosses?
What does the team decide after winning the toss?
How toss decision varies across seasons?
Does winning the toss implies winning the game?
How many times chasing team has won the match?
Which all teams had won this tournament?
Which team has played the most number of matches?
Which team has won the most number of times?
Which team has the highest winning percentage?
What was the count of matches played in each season?
Is there any lucky venue for a particular team?
Comparison between two teams.
Analysis - Indian Premier League Matches: Done in R Programming
To Get Particular batsman analysis?
Total matches that a team scoring Greater than 200 runs?
Total matches that a team conceded Greater than 200 runs?
Highest Run in an Inning?
Biggest win in terms of Run Margin?
Most balls played by a batsman?
Top 10 run scorers of all time?
Most number of 4’s?
Most number of 6’s?
Highest Strike rate (Minimum of 100 balls)?
Leading Wicket-taker ?
Total count of matches played in different stadiums?
Player of the Match award ?
Total number of fours in each season?
Total number of Six in each season ?
Total runs scored from boundaries in each season?
Total contribution of runs from boundaries in each season?
Total runs scored by teams in first 6 overs ?